
AI Reporting Automation Case Study: Turning Manual Data Collection into Executive-Ready Business Insights
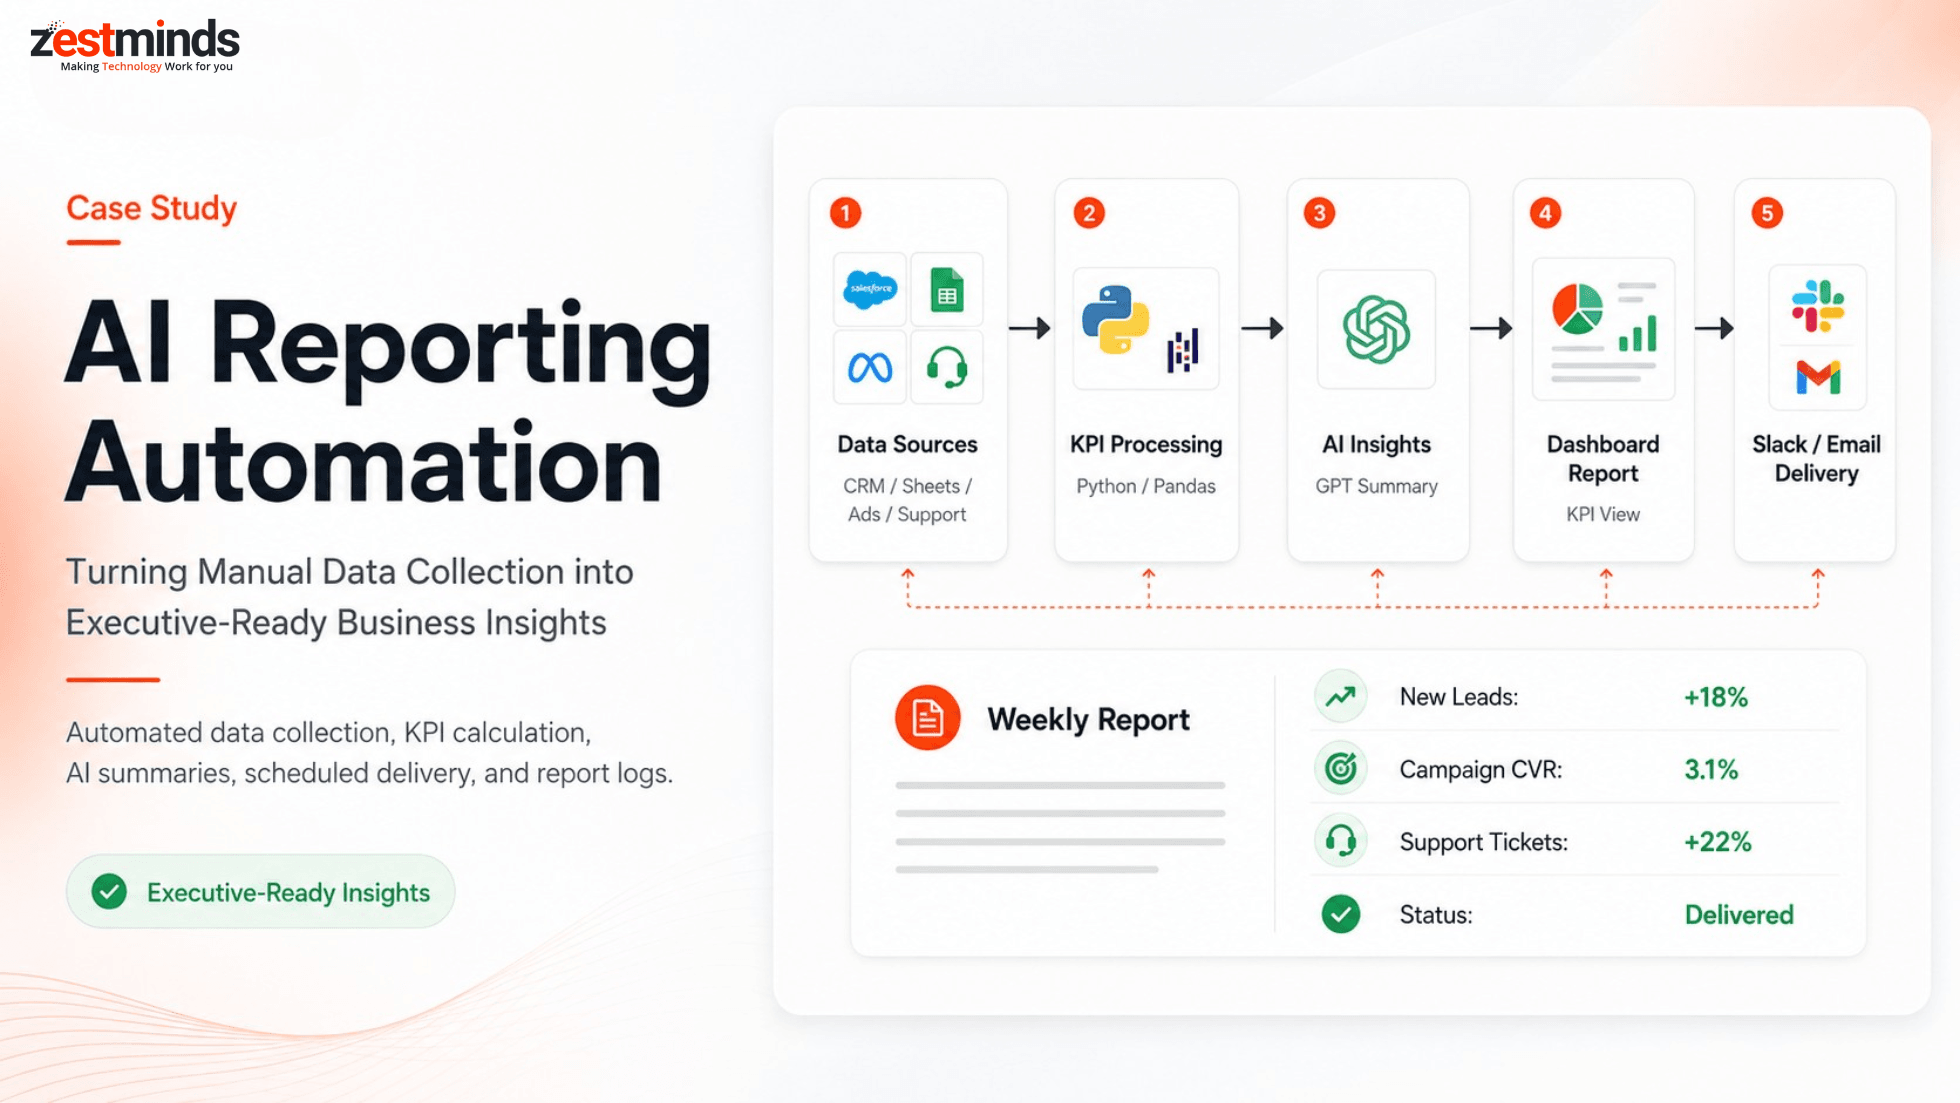
Executive Summary
A growing business team was spending several hours every week preparing reports for leadership.
Zestminds built an AI reporting automation workflow using FastAPI, Python/Pandas, OpenAI/GPT APIs, n8n, CRM and spreadsheet connectors, dashboard reporting, Slack/email delivery, PostgreSQL logs, and report history tracking.
The result was a faster, more reliable reporting workflow where the team no longer had to start every weekly report from scratch.
Project Snapshot
| Area | Details |
|---|---|
| Client Type | Operations-heavy business preparing recurring management reports |
| Function | Executive reporting, KPI tracking, data consolidation, and insight delivery |
| Main Challenge | Manual data collection, spreadsheet cleanup, delayed reports, and inconsistent summaries |
| Data Sources | CRM, Google Sheets, marketing data, support tickets, internal database, manual inputs |
| Solution | AI reporting automation with data consolidation, KPI calculation, insight generation, and scheduled delivery |
| Backend Layer | FastAPI |
| Data Processing | Python / Pandas |
| Workflow Automation | n8n |
| AI Layer | OpenAI/GPT API |
| Dashboard Layer | Metabase / Looker Studio-style dashboard |
| Delivery Layer | Slack and email reports |
| Storage / Logs | PostgreSQL / report archive |
| Business Impact | Faster reporting, reduced manual work, clearer insights, and better reporting consistency |
Client Context
The client's leadership team needed regular visibility into business performance.
Every week, they wanted a clear view of sales pipeline movement, marketing performance, support workload, operational updates, and key business metrics.
The challenge was that the data lived in different places.
Some numbers came from the CRM. Some came from Google Sheets. Some were pulled from marketing platforms. Some came from support tools. Other updates were collected manually from team members.
The reporting team needed to answer questions such as:
- How many new leads came in this week?
- Which pipeline stages changed?
- Which campaigns improved or dropped?
- Which support categories increased?
- Were there any unusual spikes or declines?
- What changed compared to last week or last month?
- What should leadership pay attention to?
- What actions should the team take next?
The team had access to the data, but preparing it into a clean leadership report took too much time.
The client wanted a reporting workflow that could automatically collect data, calculate key metrics, generate clear summaries, and deliver reports on schedule.
Manual Reporting Before Automation
Before automation, reporting was handled through a mostly manual workflow.
The usual process looked like this:
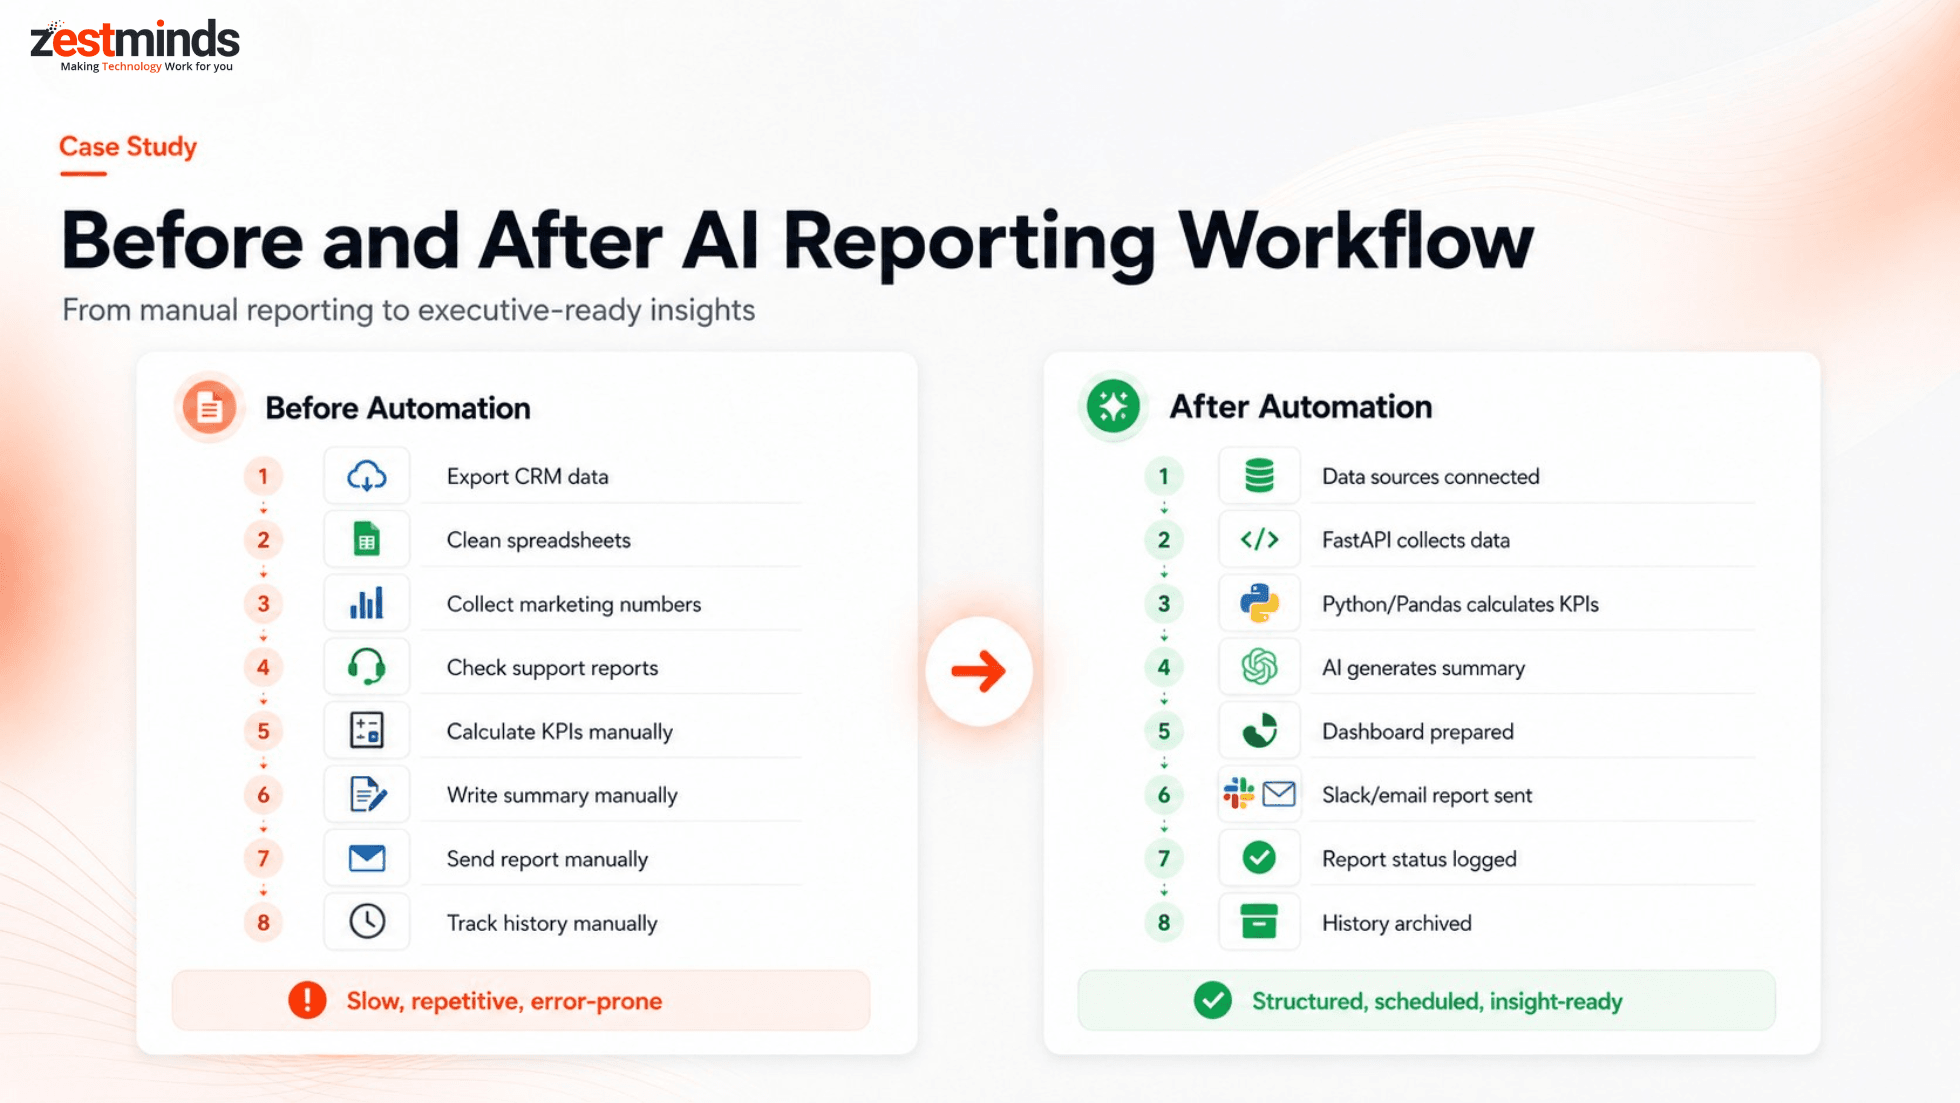
Data pulled from CRM, spreadsheets, ads, support tools, and internal systems → Team cleans and combines data manually → KPIs are calculated in spreadsheets → Charts are prepared → Insights are written manually → Report is shared by email or Slack → Reporting history is tracked manually
This created several operational issues:
- Data had to be collected from multiple tools every week.
- Spreadsheets required manual cleanup before reporting.
- KPI calculations were not always consistent.
- Reports depended heavily on the person preparing them.
- Trends and anomalies were easy to miss.
- Reports were delayed when source data was incomplete.
- Manual copy-paste increased the risk of reporting errors.
- Old reports were difficult to compare consistently over time.
The client needed a more structured reporting process.
They did not want just another static dashboard. They wanted a workflow that could turn scattered business data into executive-ready insights.
The Core Challenge
The real challenge was not simply “creating reports.”
The real challenge was turning multi-source business data into useful insights that leadership could act on.
For every reporting cycle, the system needed to:
- collect data from different tools,
- normalize inconsistent formats,
- calculate important KPIs,
- compare performance across time periods,
- detect unusual changes,
- generate a readable insight summary,
- prepare dashboard or report views,
- deliver the report to the right people,
- and keep a history of previous reports.
This required more than basic report generation.
The workflow needed API integrations, data processing, scheduled automation, AI-generated business insights, dashboard delivery, and report logging.
The goal was not to replace leadership decision-making.
The goal was to reduce manual reporting effort and give decision-makers a clearer starting point.
Automation should collect and prepare the reporting layer. AI should explain what changed. Humans should still decide what action to take.
What Zestminds Built
Zestminds built an AI reporting automation workflow as part of our AI workflow automation services, helping the client turn manual data collection into executive-ready business insights.
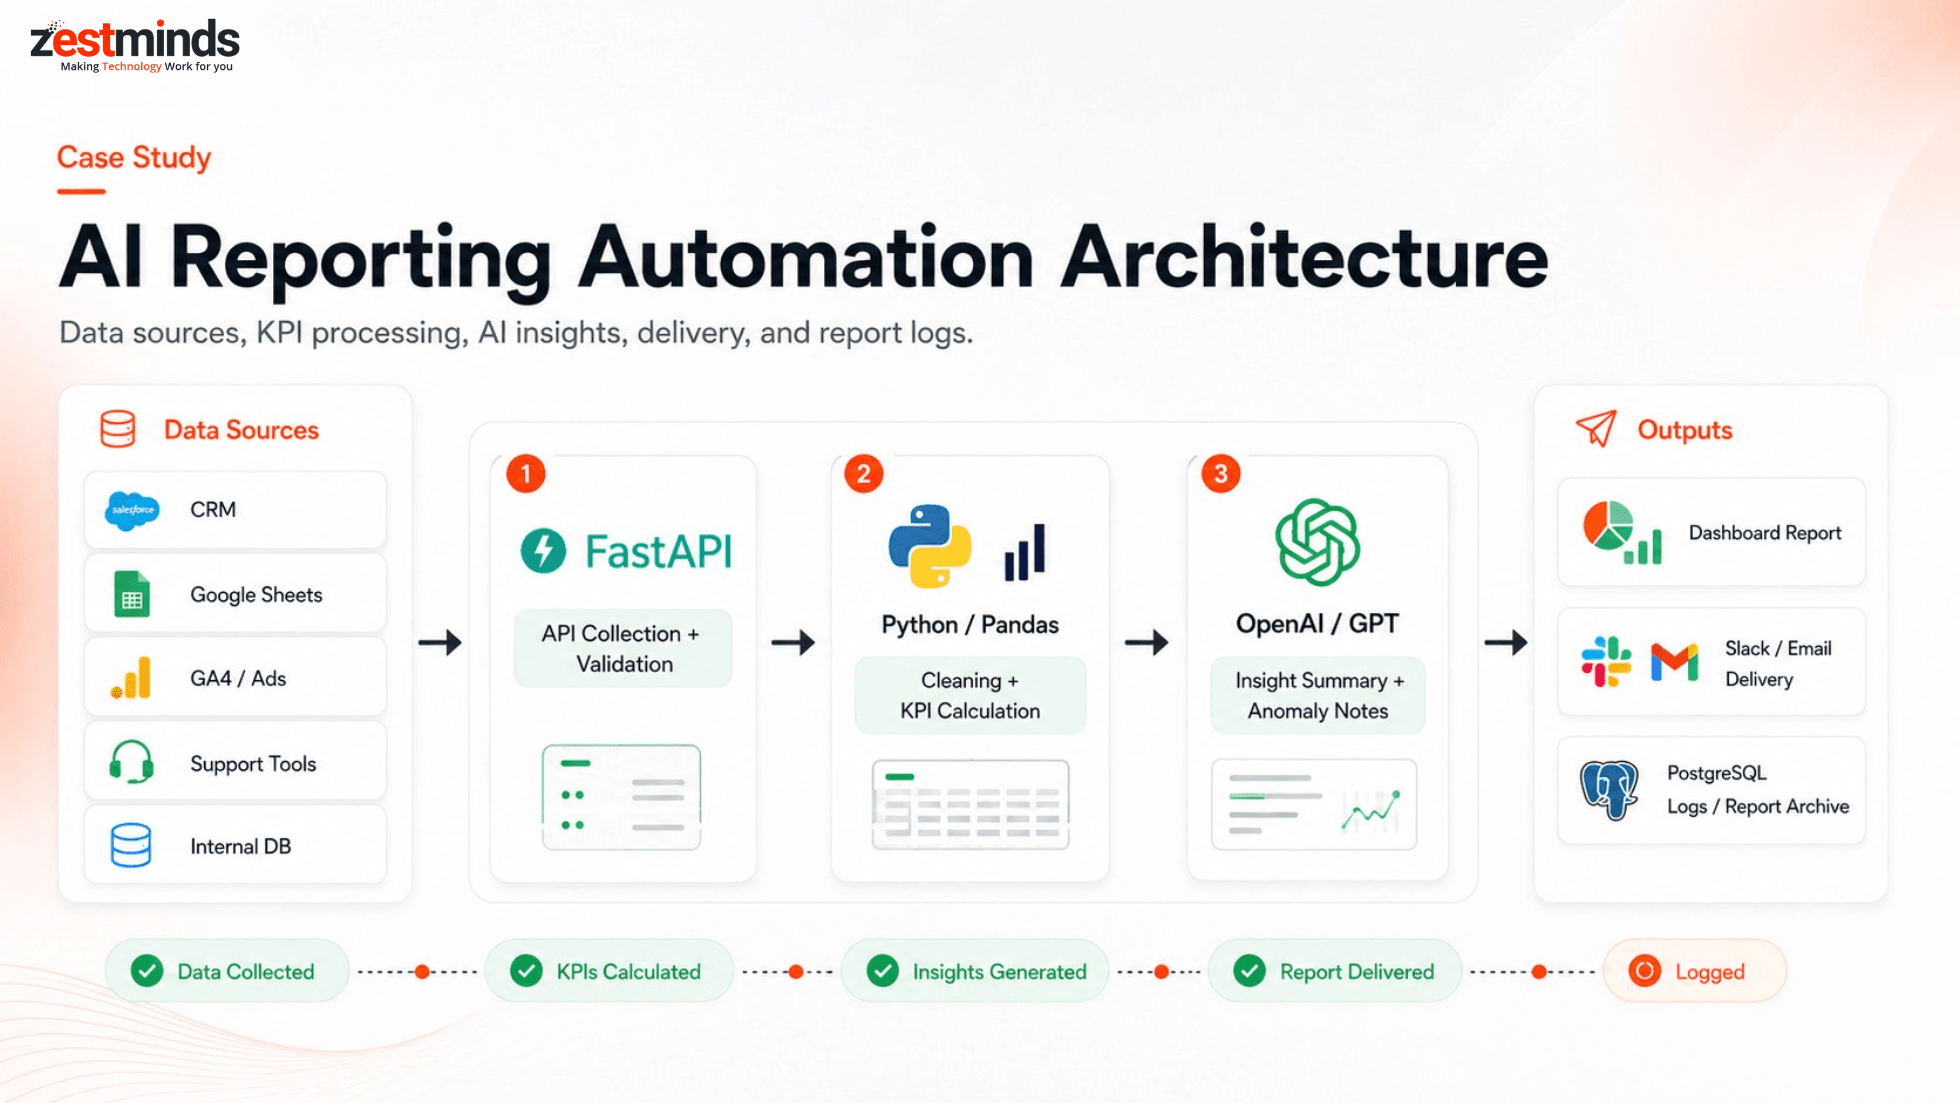
The workflow connected CRM data, Google Sheets, marketing reports, support data, internal databases, FastAPI, Python/Pandas, OpenAI/GPT APIs, n8n, dashboards, Slack/email delivery, and report logs.
FastAPI acted as the backend layer for API orchestration, scheduled data collection, validation, and reporting endpoints, a strong fit for teams looking for reliable FastAPI development services around AI and data workflows.
Python and Pandas were used for data cleaning, normalization, KPI calculations, week-over-week comparisons, and structured report preparation.
n8n helped orchestrate scheduled workflows, trigger report generation, and deliver reports to Slack and email.
OpenAI/GPT APIs were used to generate narrative summaries, explain performance changes, identify anomalies, and suggest next actions based on the prepared data.
This connects closely with our AI development services, where AI is used inside real business workflows instead of being treated as a standalone reporting experiment.
The dashboard layer gave stakeholders visual access to KPIs, trend lines, comparisons, and report snapshots.
PostgreSQL and report logs stored generated reports, data snapshots, status history, and delivery records.
AI should not guess from messy data. The system should first prepare reliable metrics, then use AI to explain the patterns in a clear and useful way.
Workflow After Automation
After automation, the reporting process became more structured and predictable.
The new workflow looked like this:
Data sources connected → FastAPI collects data → Python/Pandas cleans and calculates KPIs → AI generates insight summary → Dashboard/report is prepared → Report is delivered to Slack/email → Report status and history are logged
Automated Workflow Steps
- The system collected reporting data from CRM, spreadsheets, marketing tools, support platforms, and internal databases.
- FastAPI handled API calls, scheduled triggers, and source-level validation.
- Python/Pandas cleaned raw data and converted it into consistent reporting formats.
- KPI calculations were performed for leads, pipeline movement, campaign performance, support load, revenue indicators, and operational metrics.
- The system compared current performance with previous reporting periods.
- Trend changes and unusual movements were flagged.
- OpenAI/GPT generated a business-friendly report summary.
- Dashboard views or report snapshots were prepared for review.
- Reports were delivered automatically through Slack or email.
- Report generation status, delivery status, errors, and report history were logged.
Tech Stack Used
| Layer | Tool / Technology | Role |
|---|---|---|
| Data Sources | CRM, Google Sheets, GA4/Ads, support tools, internal database | Provided business data for reporting |
| Backend / APIs | FastAPI | API orchestration, scheduled reporting endpoints, validation, and routing |
| Data Processing | Python / Pandas | Data cleaning, normalization, KPI calculation, and comparisons |
| Workflow Automation | n8n | Scheduled workflows, report triggers, and delivery automation |
| AI Layer | OpenAI/GPT API | Generated insight summaries, anomaly explanations, and next-action suggestions |
| Dashboard Layer | Metabase / Looker Studio-style dashboard | Visualized KPIs, trends, and report snapshots |
| Delivery Layer | Slack and email | Delivered scheduled reports and alerts to stakeholders |
| Storage / Logs | PostgreSQL / report archive | Stored report history, data snapshots, status logs, and errors |
Because the workflow involved multiple data sources, API connectors, KPI logic, scheduled reports, dashboard views, and delivery logs, it required more than a simple reporting tool.
This is where custom software development becomes important for reliability and long-term maintainability.
AI Reporting Logic
The AI layer was not used directly on raw, messy data.
First, the system collected, cleaned, normalized, and calculated structured metrics. Only after that did AI generate insights from the prepared reporting data.
For each report, the AI layer helped generate:
- executive summary,
- KPI highlights,
- week-over-week changes,
- month-over-month comparisons,
- performance drops or spikes,
- possible reasons behind changes,
- risks or anomalies,
- recommended next actions,
- and plain-English reporting notes for leadership.
Example structured AI report output:
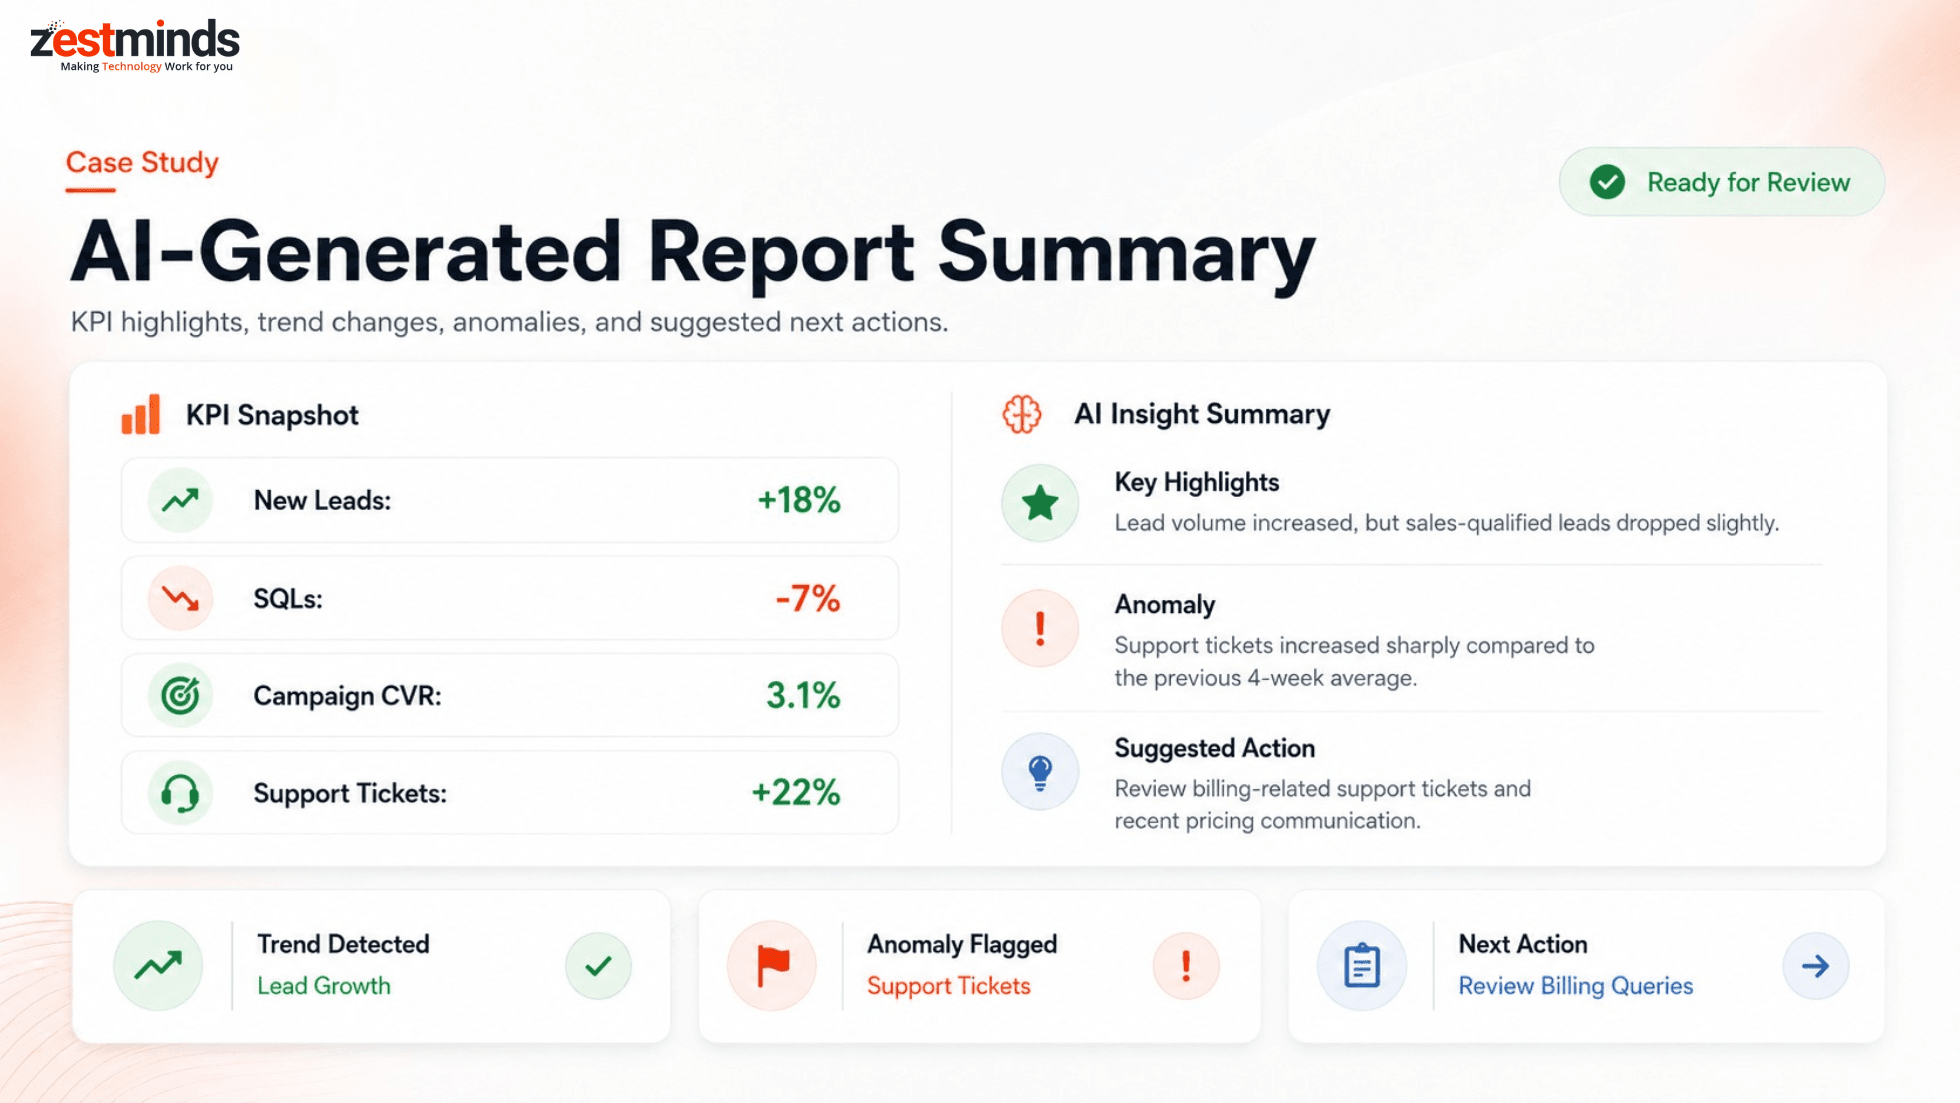
Report Period: May 13–19, 2026
Report Type: Weekly Business Performance Report

Key Highlights:
- New leads increased by 18% compared to the previous week.
- Sales-qualified leads dropped by 7%.
- Paid campaign conversion rate improved from 2.4% to 3.1%.
- Support tickets increased by 22%, mainly from billing-related queries.

Anomaly:
Support ticket volume increased sharply compared to the previous 4-week average.

Suggested Action:
Review billing-related support tickets and check whether recent pricing or invoice communication caused confusion.
This gave leadership a clear summary instead of only raw dashboard numbers.
The AI did not replace data analysis. It made the report easier to understand and faster to review.
Dashboard and Report Delivery
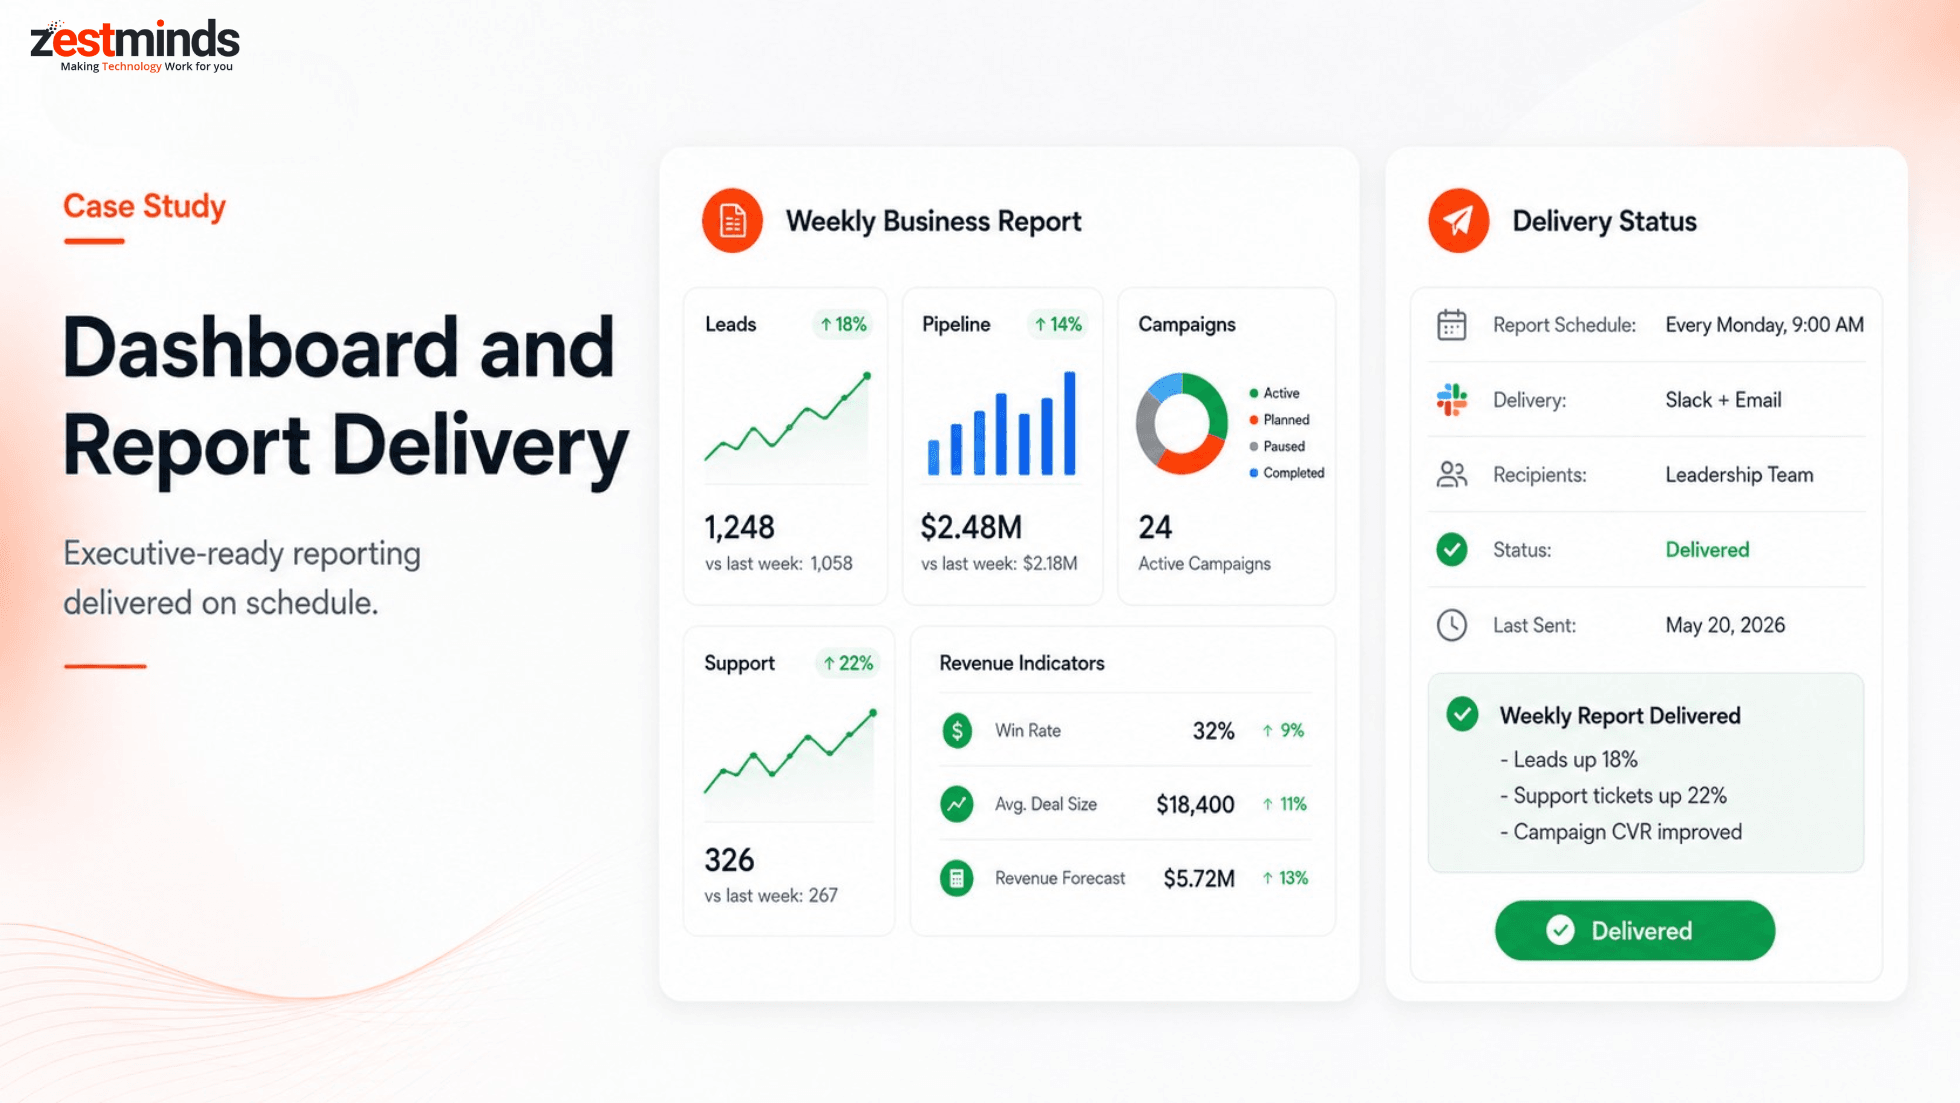
The workflow generated reports in a format stakeholders could actually use.
Depending on the client's needs, the report could be delivered as:
- dashboard snapshot,
- Slack message summary,
- email report,
- KPI table,
- weekly PDF-style report,
- or internal dashboard view.
A typical report included:
- key metrics,
- trend changes,
- performance comparisons,
- top issues,
- anomalies,
- AI-generated summary,
- and recommended next actions.
Slack and email delivery made sure the report reached the right people on schedule.
This removed the need for someone to manually prepare and send the same report every week.
Human Review and Governance
The workflow was designed to support decision-making, not automate decisions blindly.
Human review was still useful when:
- source data looked incomplete,
- a major KPI changed unexpectedly,
- AI detected an anomaly,
- leadership needed commentary before a board or management meeting,
- or the report contained sensitive financial or operational data.
The review layer allowed the team to check numbers, adjust commentary, approve the report, or add internal notes before delivery.
This made the workflow more practical for business reporting.
AI helped explain what changed, but the business team still controlled what was shared and what decisions were made.
Report Logs and Visibility
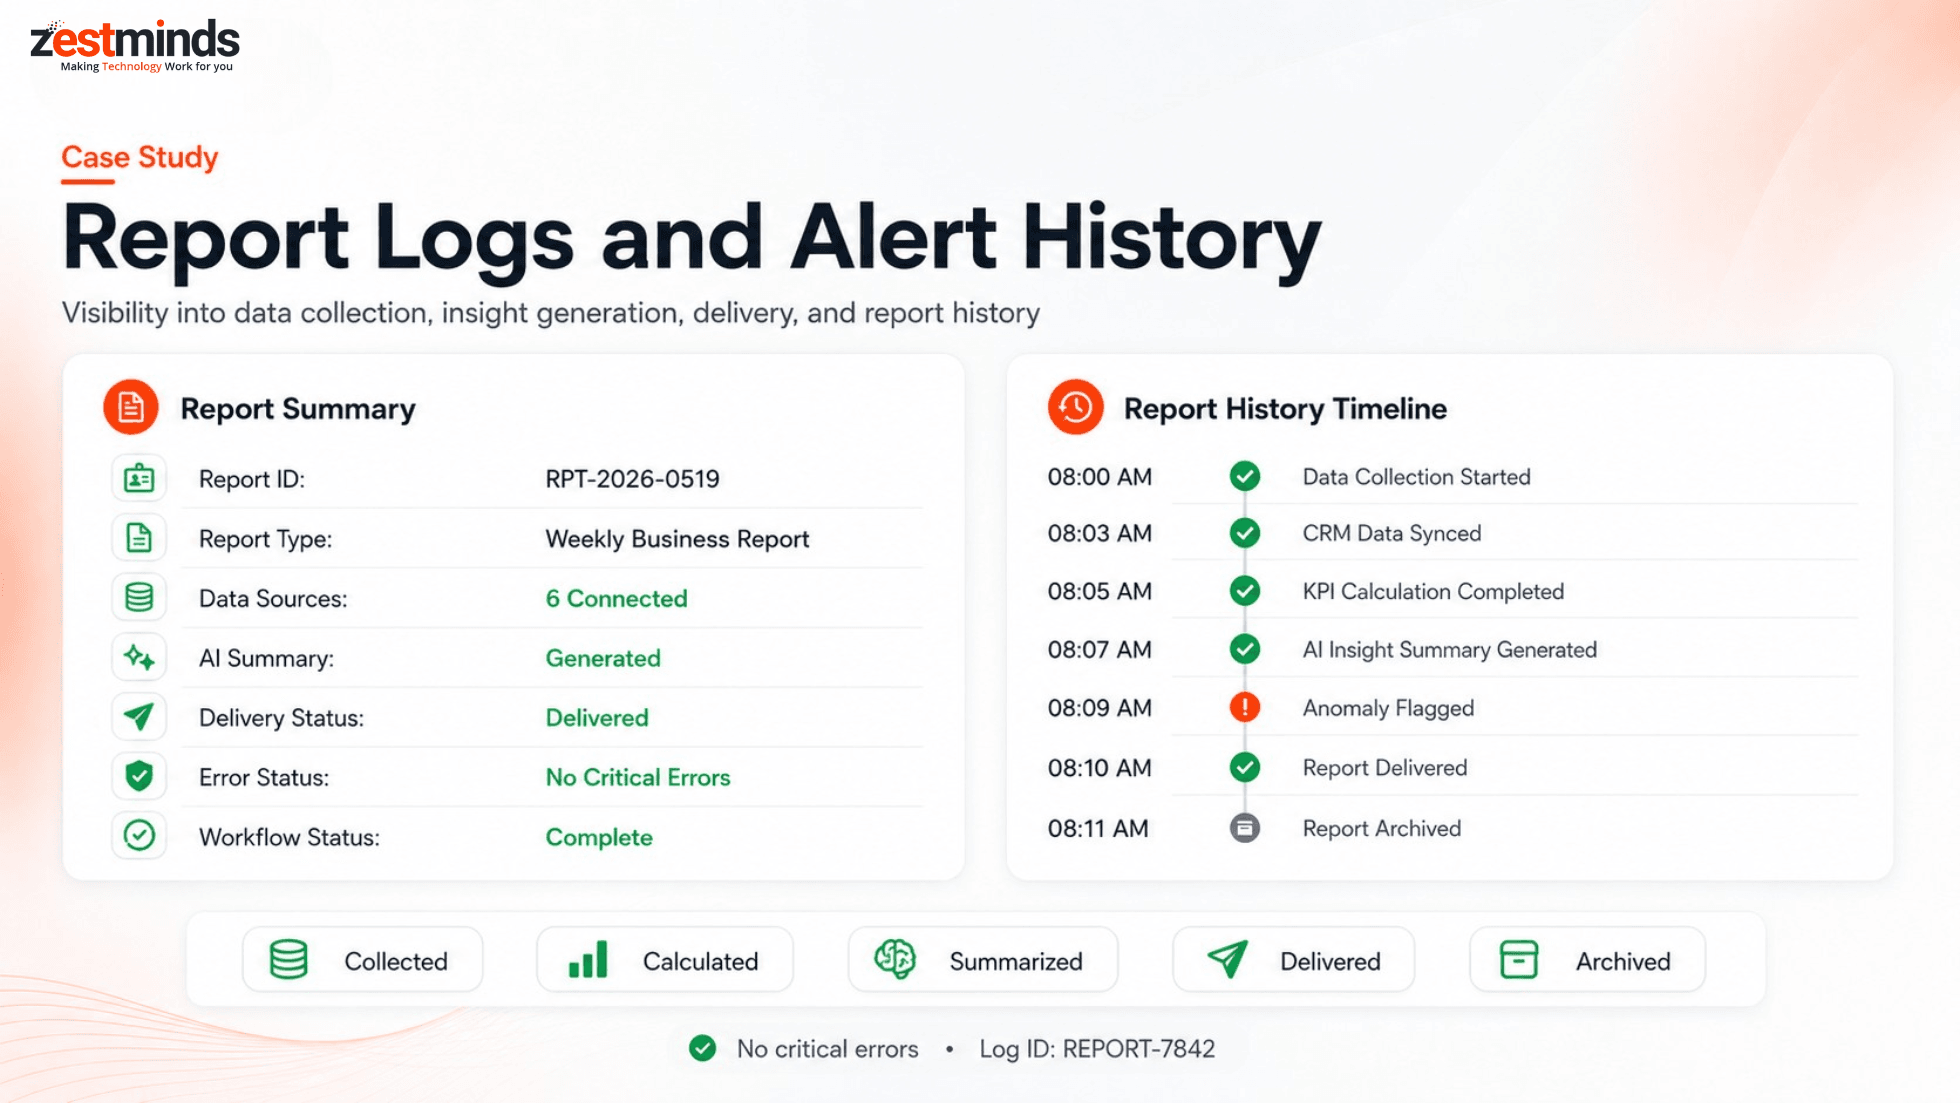
The automation also created a report history for every reporting cycle.
The team could track:
- when the report was generated,
- which data sources were used,
- whether data collection succeeded,
- whether any source failed,
- what KPIs were calculated,
- what insights were generated,
- who received the report,
- whether delivery succeeded,
- and whether any errors occurred.
This helped the team trust the reporting workflow.
Instead of asking “Was this week's report sent?” the team could see report status, delivery logs, and historical snapshots in one place.
Report history also made it easier to compare performance over time.
Results and Business Impact
The AI reporting automation helped the client reduce manual reporting work and improve reporting consistency.
The impact included:
- weekly report preparation time reduced from around 4–6 hours to 30–45 minutes,
- manual data consolidation reduced by approximately 70–80%,
- reports were delivered on a fixed schedule,
- leadership received clearer summaries with KPI context,
- unusual changes were flagged earlier,
- copy-paste reporting errors were reduced,
- report history became easier to review,
- and the team had more time to focus on decisions instead of data gathering.
The workflow did not remove the need for business judgment.
It gave the leadership team faster access to clean metrics, clearer summaries, and better visibility into what changed.
Client Feedback
The biggest value was not just getting the report faster. It was that our team no longer had to chase data across different systems before every leadership meeting. We started the discussion with insights, not spreadsheets.
This feedback reflects the real value of AI reporting automation: it reduces the manual reporting burden and helps teams spend more time on decisions.
What This Project Proves About Zestminds
This project shows Zestminds' ability to build AI reporting automation systems for real business operations.
The work was not just about creating a dashboard.
It required understanding data sources, API integrations, data cleaning, KPI logic, reporting schedules, AI-generated summaries, dashboard delivery, stakeholder notifications, and report logs.
The workflow combined:
- FastAPI backend development,
- Python/Pandas data processing,
- CRM and spreadsheet integrations,
- OpenAI/GPT-based insight generation,
- n8n workflow orchestration,
- dashboard reporting,
- Slack/email delivery,
- PostgreSQL report history,
- and workflow logs.
This is where Zestminds brings value as an AI workflow automation partner: by combining data engineering, AI insight generation, backend systems, automation tools, and business reporting needs into workflows that help teams make better decisions faster.
If you are still exploring where AI can fit into your operations, our AI workflow automation guide explains how to identify automation opportunities, plan integrations, and keep human review where it matters.
You can also read our AI document processing automation case study to see how similar extraction, validation, and review logic can be applied to document-heavy workflows.
You can explore more Zestminds work across AI, automation, and product engineering on our case studies page.
Frequently Asked Questions
What is AI reporting automation?
AI reporting automation uses data connectors, backend workflows, data processing, dashboards, and AI-generated summaries to collect business data, calculate KPIs, generate insights, and deliver reports automatically.
Which tools were used in this reporting automation workflow?
The workflow used FastAPI for backend orchestration, Python/Pandas for data processing, OpenAI/GPT APIs for insight summaries, n8n for workflow automation, dashboards for visualization, Slack/email for delivery, and PostgreSQL for logs and report history.
Did AI generate reports directly from raw data?
No. The system first collected, cleaned, normalized, and calculated structured metrics. AI was then used to explain trends, anomalies, and recommended next actions in plain language.
What kind of reports can this workflow support?
The workflow can support weekly business reports, sales pipeline reports, marketing performance reports, support performance reports, operational reports, KPI summaries, dashboard snapshots, and executive updates.
What was the main business benefit?
The workflow reduced manual reporting time, improved consistency, helped flag important changes earlier, and allowed leadership to start discussions with insights instead of manually prepared spreadsheets.
Need Help Automating Business Reporting?
Zestminds can help you build an AI reporting automation workflow that connects your data sources, cleans and calculates KPIs, generates insight summaries, delivers reports, and keeps reporting history visible.
Whether your reports depend on CRM data, spreadsheets, marketing platforms, support tools, or internal databases, we can help turn scattered data into executive-ready business insights.
Table of Contents
- Project Snapshot
- Client Context
- Manual Reporting Before Automation
- The Core Challenge
- What Zestminds Built
- Workflow After Automation
- Tech Stack Used
- AI Reporting Logic
- Dashboard and Report Delivery
- Human Review and Governance
- Report Logs and Visibility
- Results and Business Impact
- Client Feedback
- What This Project Proves About Zestminds
- Frequently Asked Questions
- Need Help Automating Business Reporting?
Before You Scale Further, Review the Architecture.
Let’s evaluate where your system stands — and where it may break under growth.
Schedule an Architecture Review 30-minute technical discussion. No obligation.