What Breaks First When a FastAPI App Hits Real Production Traffic
FastAPI production issues rarely show up in demos or early launches. They appear when traffic patterns change, databases are stressed, and assumptions about "async" meet reality. Most failures are not dramatic crashes. They are slowdowns, stuck requests, timeout spikes, and systems that quietly stop scaling.
This article breaks down what typically fails first, why it fails, and what experienced teams review before production traffic exposes weak points.
For broader FastAPI planning, setup, deployment, and scaling topics, you can also explore our FastAPI guides and production resources.


Async Isn't Your Bottleneck, Your Blocking Code Is
Async is usually the first thing people point to when performance degrades.
"I thought async was supposed to scale."
It does, but only under conditions that real production systems rarely meet by default. This is one of the most common FastAPI production issues teams run into after launch.
Async works well when the full request path is designed around non-blocking behavior. The problem starts when an endpoint looks async at the syntax level but still depends on blocking database calls, synchronous libraries, slow external APIs, or CPU-heavy work inside the request lifecycle.

What async actually guarantees and what it does not
Async guarantees that your server can handle many concurrent requests if:
- All I/O is non-blocking
- Work yields control back to the event loop
- CPU-heavy tasks stay out of the request path
- Database and HTTP clients are chosen carefully
Async does not guarantee:
- Faster responses by default
- Automatic scalability
- Protection from blocking libraries
- Safe handling of unlimited concurrency
That gap matters in FastAPI because it is easy to look async while behaving synchronously.
The most common async illusion
A typical FastAPI route may look like this:
@app.get("/users/{id}")
async def get_user(id: int):
    user = db.query(User).filter(User.id == id).first()
    return user
On paper, this is async.
In production, it often is not.
If db.query() relies on:
- A synchronous SQLAlchemy engine
- A blocking network call
- Disk-bound operations
- A slow external dependency
Every request can block the event loop.
Quick answer: FastAPI is only truly async in production if every dependency inside the request path is non-blocking. Otherwise, concurrency collapses silently.
Why this hurts only under real traffic
Blocking code compounds with concurrency.
At 5 requests per second, the impact can stay invisible. At 200 concurrent requests, one slow call can stall dozens of others.
What teams usually observe:
- Latency spikes without high CPU usage
- Requests hanging with no obvious error
- Adding workers helps only for a short time
- Throughput stops improving even after scaling the app server
That temporary relief often sends teams down the wrong path. They scale infrastructure instead of fixing the root cause.
Another subtle issue appears when teams mix patterns:
- Async endpoints
- Sync ORM calls
- Async HTTP calls
- CPU-heavy serialization
- Large response payloads
Individually, each choice may seem reasonable. Together, they create unpredictable behavior under load.
The practical lesson is simple: async is an architectural contract, not a syntax choice. If blocking work lives in the request path, FastAPI's async model becomes limited long before the framework itself becomes the problem.
Database Connections Saturate Before CPUs Do

If async misuse is the first crack, the database is usually the first real break.
This is where FastAPI production issues stop being theoretical and start impacting users.
Why databases feel fine, until they do not
APIs scale horizontally. Databases scale cautiously.
Your FastAPI service might accept thousands of concurrent requests. Your database is designed to serve a far smaller number of concurrent connections efficiently, with hard limits that are documented in managed database platforms such as AWS RDS connection constraints and service quotas in the official Amazon RDS limits documentation.
That mismatch creates a familiar illusion: "the API is slow."
In reality, the API is often waiting for the database to say "okay."
| Layer | What Scales Well | Hard Limit | First Symptom |
|---|---|---|---|
| FastAPI app | Concurrent request handling | Downstream capacity | Latency spikes without CPU pressure |
| ORM / session layer | Developer velocity | Session lifetime and connection usage | Long waits and hanging requests |
| Database | Query execution within limits | Connection pool and max connections | Timeouts and queue buildup |
| Infrastructure | CPU and memory headroom | Open sockets and worker concurrency | Throughput plateau with idle CPU |
The classic production failure pattern
This pattern shows up repeatedly in production systems:
- Traffic grows steadily
- API latency creeps up
- Timeouts appear sporadically
- CPU and memory still look healthy
- Database connection pool becomes exhausted
At this stage, requests usually do not fail immediately. They queue, wait, and then time out.
Quick answer: When a FastAPI app slows down under load while CPU looks fine, the issue is often exhausted database connections, blocking I/O, or worker saturation rather than the framework itself.
Why FastAPI reaches this limit faster
FastAPI encourages concurrency by design. Each concurrent request often means:
- A database session
- A transaction
- A connection checkout
- A downstream dependency call
Common production mistakes include:
- No intentional max pool size
- Long-lived ORM sessions
- Lazy-loading during response serialization
- Sync database drivers inside async routes
- No timeout around database operations
Each issue alone may be manageable. Together, they overwhelm the database faster than expected.
The quiet danger of connection leaks
Production traffic is messy. Not every request follows the happy path.
If sessions are not closed consistently:
- Connections remain open
- Pools shrink over time
- Failures appear hours after deployment
- Restarting the app appears to fix the issue temporarily
That temporary fix is often the clue. If a restart makes the issue disappear for a while, look closely at connection lifecycle, session handling, worker restarts, and long-running transactions.
Teams that scale FastAPI successfully treat the database as a limited shared resource:
- Explicit pool sizing
- Short-lived transactions
- Clear read/write expectations
- Slow query monitoring
- Connection wait-time visibility
When that discipline is missing, database pressure becomes one of the most painful FastAPI production issues to debug.
Uvicorn/Gunicorn Defaults Fail at Scale
Defaults are designed to get you running, not to keep you safe under pressure.
Most FastAPI apps reach production with:
- Default worker counts
- Default timeout behavior
- Default event loop behavior
- No explicit concurrency limits
- No tested backpressure strategy
This works until traffic patterns change.
Most performance plateaus trace back to deployment defaults that were never revisited after launch, particularly around workers, concurrency limits, process models, timeouts, and queueing behavior.
Why defaults feel fine early on
Early production traffic is usually:
- Predictable
- Evenly distributed
- Similar across endpoints
- Low enough to hide slow dependency calls
Defaults handle this surprisingly well.
Problems start when:
- Traffic spikes suddenly
- One endpoint slows down
- Background work overlaps with requests
- Worker queues grow faster than they drain
- Database limits become tighter than app-server limits
Defaults offer very few guardrails here.
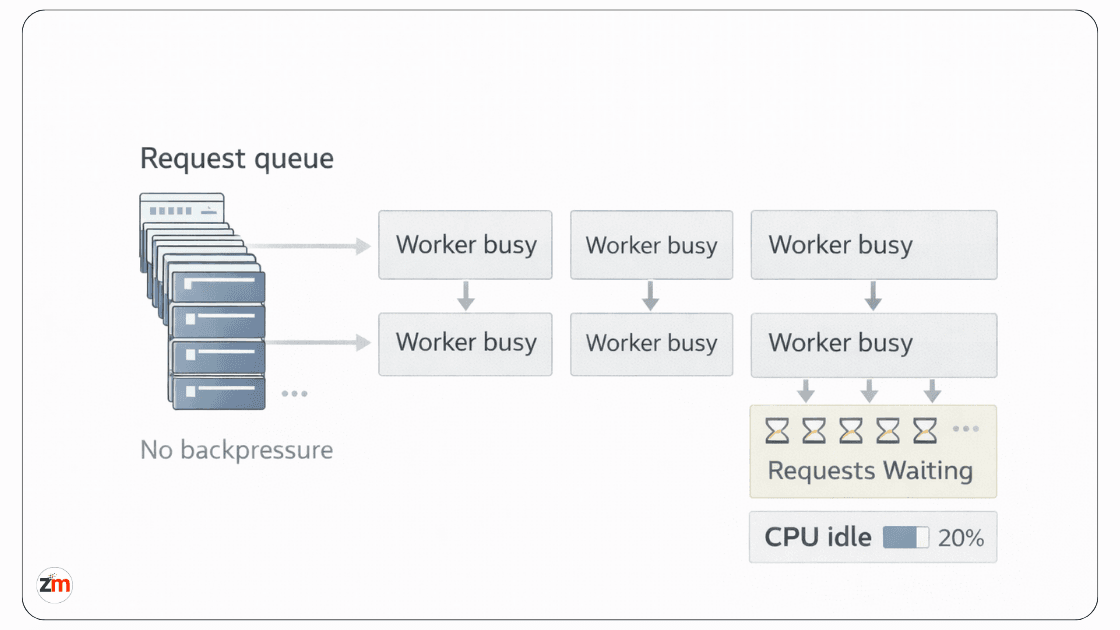
The plateau problem
A common symptom looks like this:
- Traffic increases
- Throughput stops increasing
- Latency climbs
- Error rates stay low at first
- CPU looks idle
Nothing looks like it is on fire. From the inside, workers are saturated with slow requests and the event loop is congested. This kind of overload pattern is similar to throttling and backpressure scenarios described in Microsoft's throttling and overload handling guidance.
Silent failure modes like this are dangerous. Crashes trigger alerts. Slowness quietly erodes trust.
When these issues move beyond application code into worker strategy, deployment topology, autoscaling, and runtime limits, they usually become a platform engineering support for production systems problem.
Do Uvicorn and Gunicorn workers share memory?
No. Uvicorn and Gunicorn workers run as separate processes. That means in-memory state is not safely shared across workers.
This matters when teams rely on:
- In-memory counters
- Local caches
- Temporary task state
- Session-like data stored inside the process
- Background work tied to one worker
If the data must be shared, it should live outside the worker process, usually in Redis, a database, a shared cache, or a queue. Otherwise, the app may behave differently depending on which worker receives the request.
Observability Is Missing When You Need It Most
When something breaks in production, the worst part is often not the failure. It is not knowing why.
Why FastAPI apps feel opaque under stress
Many FastAPI systems rely on:
- Basic logs
- Generic error handlers
- Occasional debug statements
- Infrastructure metrics without request-level context
That may be enough during early traffic. It is not enough when:
- Requests become asynchronous
- Failures span multiple services
- Latency becomes intermittent
- External APIs retry silently
- Database pool wait time grows without clear errors
At that point, logs stop telling a complete story.
Common observability gap:
- What you see: "Request took 8 seconds."
- What is missing: where time was spent across database, cache, queue, and external services.
- Why debugging stalls: no trace context, no dependency timing, no correlation ID.
- What teams guess instead: "DB is slow" or "async is not working," without proof.
FastAPI observability checklist for production
A production FastAPI application should make the following visible before traffic grows:
- Request count by endpoint
- p95 and p99 latency
- Error rate by endpoint
- Database query duration
- Database connection pool usage
- Connection checkout wait time
- External API response time
- Timeout and retry counts
- Worker restarts
- Queue depth and background task failures
- Structured logs with request IDs
- Trace or correlation IDs across services
If your team needs a standards-based way to add traces and request visibility, the OpenTelemetry FastAPI instrumentation docs are a useful technical reference.
For teams that need better monitoring, alerting, deployment reliability, and cloud-side visibility, DevOps and cloud engineering support can help close the gap before production issues become outages.
Async raises the debugging bar
Async execution fragments the debugging experience:
- Errors surface far from causes
- Stack traces may lose useful context
- Timing issues are harder to reproduce
- One slow dependency can distort multiple request paths
A slow request might involve:
- A database lock
- An external API retry
- A background task collision
- A connection pool wait
- An overloaded worker
Without instrumentation, all you see is "request took 8 seconds."
Observability is rarely added too early, but it is often added too late. Once traffic grows, adding it safely becomes harder because you are debugging and instrumenting at the same time.
Background Tasks and Queues Become a Hidden Risk

Background tasks are where many FastAPI systems quietly lose reliability.
Why background work feels harmless at first
FastAPI makes it easy to:
- Fire off tasks
- Avoid extra infrastructure
- Move quickly during early development
- Keep simple work close to the request lifecycle
That convenience is real. So is the risk.
FastAPI's official Background Tasks documentation explains the built-in feature well. The production question is not whether the feature exists, but whether the work is safe to keep inside the same process under load.
What changes under load
In-process background tasks:
- Share workers with requests
- Compete for CPU and I/O
- Can disappear on worker restarts
- Are harder to retry safely
- Are harder to monitor at scale
Under light traffic, this is invisible. Under load, it becomes unpredictable.
A common production moment looks like this: emails do not send, webhooks do not fire, but nothing obvious appears in the logs.
Queues add complexity, but they add isolation. Isolation is what production systems need when background work becomes important.
FastAPI BackgroundTasks vs Celery: when to use what
| Use Case | FastAPI BackgroundTasks | Celery or Queue Worker |
|---|---|---|
| Simple non-critical email | Acceptable early on | Better when volume grows |
| Payment or webhook processing | Risky | Recommended |
| Long-running jobs | Not ideal | Recommended |
| Retries required | Limited | Strong fit |
| Task monitoring needed | Limited | Better fit |
| Safe execution across restarts | Risky | Better fit |
FastAPI does not force this discipline. Production eventually does.
FastAPI Production Symptoms: What They Usually Mean
Production issues become easier to debug when symptoms are mapped to likely causes. The table below is not a replacement for real tracing, but it gives teams a practical starting point.
| Symptom | Likely Cause |
|---|---|
| CPU is low, but latency is high | Database pool exhaustion, blocking I/O, or slow external dependency |
| Throughput stops increasing | Worker saturation or downstream capacity limit |
| Requests hang without clear errors | Connection pool wait, blocking call, or missing timeout |
| Timeouts appear randomly | External API retries, database locks, or queue buildup |
| Emails or webhooks fail silently | Unsafe in-process background tasks |
| Restart temporarily fixes the issue | Connection leak, worker state issue, or resource buildup |
| Logs show only slow requests | Missing tracing, dependency timing, or correlation IDs |
This is why production readiness is not only about writing correct code. It is about seeing the system clearly when traffic, dependencies, and runtime limits interact.
FastAPI Isn't the Problem, Production Assumptions Are

At some point, teams start questioning the framework.
"Should we rewrite?"
"Is FastAPI the wrong choice?"
In most cases, no.
What actually failed
Across teams, the same assumptions break:
- Async equals scalability
- Defaults are production-safe
- Databases scale linearly
- Background work is trivial
- Observability can wait
- More workers always means more capacity
FastAPI does not cause these issues. It simply exposes them faster.
That is why some FastAPI systems scale calmly to high traffic while others struggle much earlier. The difference is rarely the framework alone. It is the expectations and production discipline around it.
FastAPI rewards teams who think in systems, not shortcuts. If your app is already live or close to launch, a focused production review is often safer than rushing into a full rewrite.
Assumptions vs reality framework
- Assumption: Async equals scalability. Reality: Dependencies determine concurrency.
- Assumption: Defaults are production-safe. Reality: Defaults hide limits until traffic changes.
- Assumption: Databases scale linearly. Reality: Databases enforce hard ceilings first.
- Assumption: Background tasks are harmless. Reality: Critical background work needs isolation, retries, and monitoring.
- Assumption: Observability can wait. Reality: Without it, production debugging becomes guesswork.
FastAPI Production Readiness Checklist Before Real Traffic Hits
A FastAPI production checklist should not be a generic launch list. It should validate the exact assumptions production traffic will test first.
Application and async behavior
- Confirm async routes are not calling blocking dependencies.
- Review sync ORM usage inside async endpoints.
- Move CPU-heavy work out of the request path where possible.
- Set timeouts for database, cache, and external API calls.
- Check large response serialization paths under load.
Database and connection handling
- Configure database pool size intentionally.
- Track active connections and connection wait time.
- Keep transactions short-lived.
- Review lazy-loading inside response generation.
- Monitor slow queries and lock behavior.
Workers, deployment, and runtime limits
- Review Uvicorn/Gunicorn worker count against CPU, memory, and DB capacity.
- Define request timeout behavior.
- Check graceful shutdown behavior.
- Avoid depending on in-memory worker state.
- Test traffic spikes, not just average traffic.
Background tasks and queues
- Identify which background tasks are critical.
- Move retry-heavy or long-running jobs to Celery or another queue.
- Track failed background jobs.
- Make task execution idempotent where needed.
- Avoid hiding business-critical workflows inside in-process tasks.
Observability and response readiness
- Add structured logs with request IDs.
- Track p95 and p99 latency.
- Track endpoint-level error rates.
- Trace external dependencies.
- Create alerts for timeout spikes, worker restarts, and queue buildup.
This checklist does not guarantee that nothing will break. It helps reveal the places most likely to break before users feel them.
One Practical Next Step
Taken together, these patterns explain why FastAPI production issues rarely come from the framework itself. They usually come from untested assumptions around async behavior, database limits, deployment defaults, background work, and observability gaps that surface only under real traffic.
If you are already running FastAPI in production, or planning to launch soon, the next step is not always a rewrite. Often, it is a careful production-readiness review.
Need a FastAPI production readiness review? Zestminds can review async and sync mismatches, database pool pressure, worker configuration, observability gaps, and background task reliability before these issues become user-facing incidents.
You can also review our production-grade software case studies to see how we approach complex product and platform builds.
It is not about adding more infrastructure for the sake of it. It is about validating the assumptions that production will test first.
Frequently Asked Questions
What usually breaks first when a FastAPI app hits production traffic?
FastAPI apps usually show database connection pressure, blocking async code, worker saturation, and background task reliability issues before they show hard crashes.
Why does a FastAPI app become slow even when CPU usage is low?
Low CPU with high latency often means the app is waiting on database connections, blocking I/O, slow external APIs, or saturated workers instead of doing CPU-heavy work.
Is FastAPI async really async in production?
FastAPI is only truly async when the full request path uses non-blocking dependencies. Sync ORMs, blocking network calls, or CPU-heavy work inside async routes can block concurrency.
What should be included in a FastAPI production checklist?
A FastAPI production checklist should review async dependencies, database pool limits, worker settings, request timeouts, background jobs, logging, tracing, alerts, and load-test behavior.
What should you monitor in a production FastAPI application?
Monitor p95 and p99 latency, error rates, worker restarts, database pool usage, query duration, external API timing, queue depth, background task failures, and timeout spikes.
When should FastAPI BackgroundTasks be replaced with Celery?
Use Celery or another queue when tasks need retries, persistence, monitoring, scheduling, long-running execution, or reliability across worker restarts.
Do Uvicorn or Gunicorn workers share memory in FastAPI?
No. Uvicorn and Gunicorn workers run as separate processes. In-memory state is not shared safely, so shared data should live in Redis, a database, cache, or queue.
Do Uvicorn or Gunicorn default settings work for production FastAPI apps?
Defaults can work for early traffic, but production apps usually need tuned worker counts, timeouts, concurrency limits, logging, health checks, and deployment-specific testing.
Table of Contents
- Async Isn't Your Bottleneck, Your Blocking Code Is
- Database Connections Saturate Before CPUs Do
- Uvicorn/Gunicorn Defaults Fail at Scale
- Observability Is Missing When You Need It Most
- Background Tasks and Queues Become a Hidden Risk
- FastAPI Production Symptoms: What They Usually Mean
- FastAPI Isn't the Problem, Production Assumptions Are
- FastAPI Production Readiness Checklist Before Real Traffic Hits
- One Practical Next Step
- Frequently Asked Questions
Shivam Sharma
Before You Scale Further, Review the Architecture.
Let’s evaluate where your system stands — and where it may break under growth.
Schedule an Architecture Review 30-minute technical discussion. No obligation.